Product Update: Brand-New Real-Time Browser Console Is Live
Advanced Data Extraction Specialist
Previously, when users ran a browser in Playground or Sessions, they couldn't access key debugging information like the browser's Console, Network activity, DOM changes, or event traces. For example:
- Want to see error messages? You had to manually open DevTools.
- Want to check console logs? Not possible.
- Need to reproduce an earlier session? Very limited visibility.
To address these debugging needs, we’re excited to introduce the Browser Console and Log Replay features. These allow you to monitor real-time browser state — just like local development — when using Scrapeless Playground or reviewing Session Replays. You’ll gain full, intuitive visibility into how your browser behaves, including console logs, network events, and DOM updates.
What Can This Feature Do?
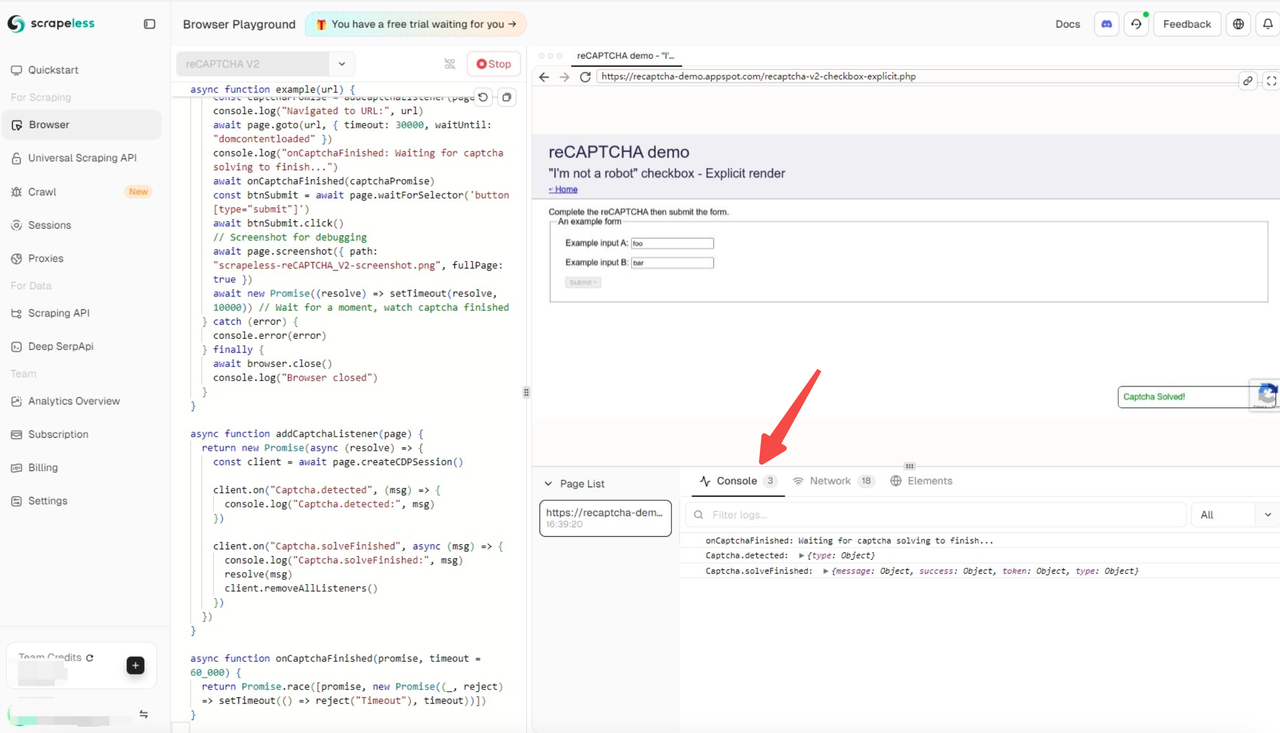
Real-time Console in Playground
View console output, debug logs, and error messages directly within the page while your script is running—no need to open the browser's DevTools separately.
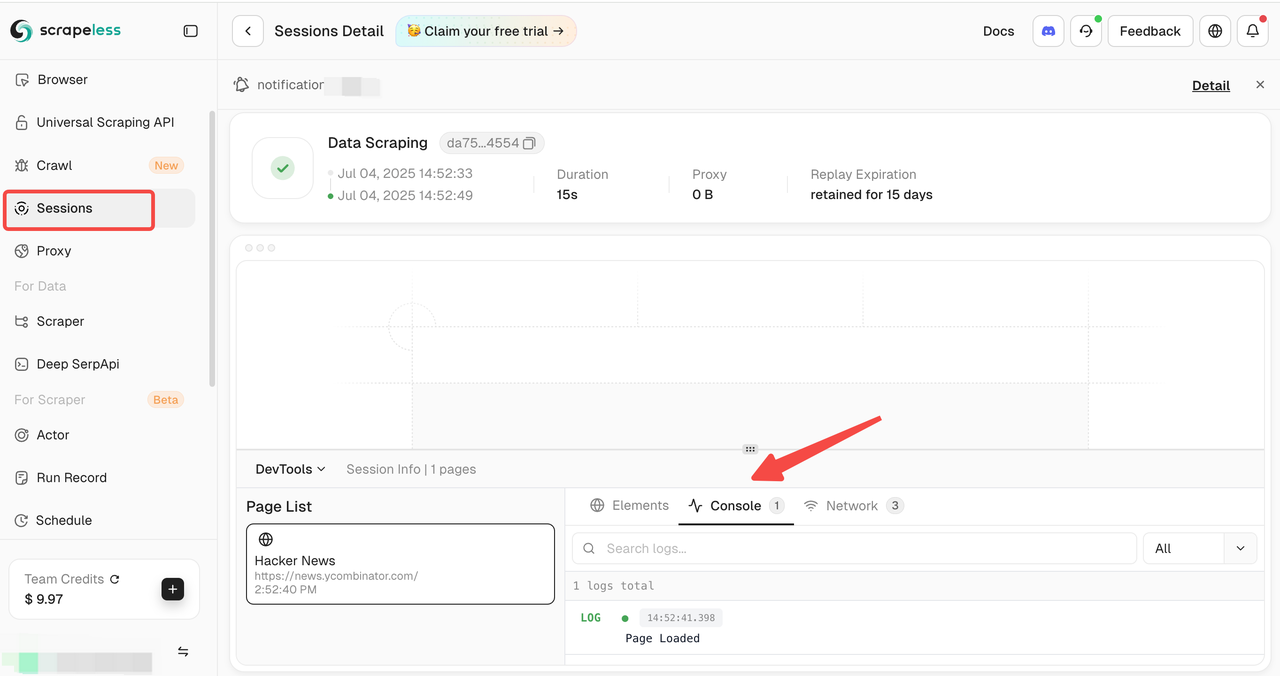
Console View in Sessions Replay
When reviewing historical sessions, you can now inspect the Console, Network, and Elements panel by page and by action.
At the end of each session, a new message appears:
"Session saved successfully. View Session"
Clicking it takes you straight to the session details for quick debugging and review.
Multi-tab Debug View
A single interface supports Console / Network / Elements tabs with seamless switching—giving you a complete picture of page behavior from different perspectives.
Whether you’re:
- Debugging a script for the first time
- Reviewing and analyzing a production issue
- Collaborating with teammates to trace a problem
You can now quickly identify the root cause and reduce communication overhead.
What’s Improved in This Update?
Playground: Real-Time Console for Seamless Debugging
With this update, every time you click Run in Playground, you’re not just launching a browser instance — you're also enabling real-time Console monitoring.
Whether it's log output, error messages, or debugging information, everything is now clearly visible in one place.
Key Improvements:
-
Session Persistence
All logs are saved after execution and linked to the session history — you can replay them anytime. -
Flexible Layout
The Console panel is now shown alongside DOM, Network, and Events, with easy tab switching for a full debugging experience. -
Auto-Refreshing Logs
No need to manually refresh — logs scroll and update in real time as your script runs.
Sessions: Console / DOM / Network / Events Log Replay
It's not just Playground — Session Replay has also been upgraded. You can now fully review and trace key browser activities captured during each session:
- Console: All browser logs generated during the session playback
- DOM: Structural changes to the page over time
- Network: All requests, responses, and resource loading details
- Events: User interactions and system-triggered events
This enhancement makes it easier to diagnose issues post-run, audit automation behavior, or share insights with your team.
Feature Highlights
-
Multi-Page Support
Easily switch between different URLs within a session to view corresponding logs. -
Lazy Loading Optimization
Log data is loaded only when the corresponding panel is accessed, reducing unnecessary requests and improving performance. -
Friendly Empty States
When no logs are captured, clear and informative messages are displayed to indicate the status.
New: Full-Screen Preview & One-Click Live URL Sharing
Two major usability improvements to enhance collaboration and debugging:
Full-Screen Mode
Both Playground and Sessions now support full-screen viewing, giving you more space to preview, inspect, and debug with focus.
One-Click Live URL Sharing
You can now instantly copy the Live URL of any Playground or Live Session with a single click — making it easy to share with teammates or clients, with no login or extra configuration required.
Feature Demo
Network – Diagnose Page Load and Request Issues
In the Network panel (similar to DevTools), you can clearly observe the loading time and resource type for each request. Common performance bottlenecks include:
- Large Image Files: High-resolution images that aren’t compressed can significantly delay page load times.
- Third-Party Script Failures: Failed plugin JS requests may block critical page rendering.
- Too Many Small Files: Hundreds of small requests can overwhelm the browser’s request queue and cause delays.
By analyzing this data, you can quickly identify and optimize critical resources to significantly improve overall page performance.
Monitoring response status codes helps you quickly identify the root cause of issues:
- 404 Not Found: The API endpoint is incorrect — likely due to a wrong or misspelled path.
- 500 Internal Server Error: The backend encountered an error — check server logs for more details.
- 400 Bad Request: The request parameters don’t meet the API’s expected format or structure.
The Network panel provides clear visibility into request payloads, response bodies, and error messages — making it an essential tool for diagnosing API-related issues.
Elements: Inspect the Actual Page Structure
The Elements panel allows you to directly view the current page’s HTML structure and associated CSS styles.
You can:
- Check whether a specific element has been successfully rendered
- Modify styles in real time to verify layout or interaction effects
- Inspect hidden elements or dynamically loaded components within the DOM
This is often the first step in diagnosing issues such as "why an element isn’t visible" or layout-related bugs.
Console: Debug & View Error Logs
By inserting console.log() statements into your code, you can:
- Output variable values and runtime states
- Trace the order of function calls
- Quickly pinpoint logical errors
This is especially valuable when debugging automation scripts or complex business logic.
Who Is This Feature For?
- QA Teams: Debug automation scripts and verify whether UI interactions behave as expected
- Engineering Teams: Develop and troubleshoot complex browser workflows, quickly identifying abnormal behaviors
- SaaS Operations: Monitor frontend behavior on the user side to optimize conversion paths and overall experience
- Technical Support: Reproduce user actions remotely to quickly identify and resolve issues
👉 Open Playground now and start your first real-time debugging session.
At Scrapeless, we only access publicly available data while strictly complying with applicable laws, regulations, and website privacy policies. The content in this blog is for demonstration purposes only and does not involve any illegal or infringing activities. We make no guarantees and disclaim all liability for the use of information from this blog or third-party links. Before engaging in any scraping activities, consult your legal advisor and review the target website's terms of service or obtain the necessary permissions.