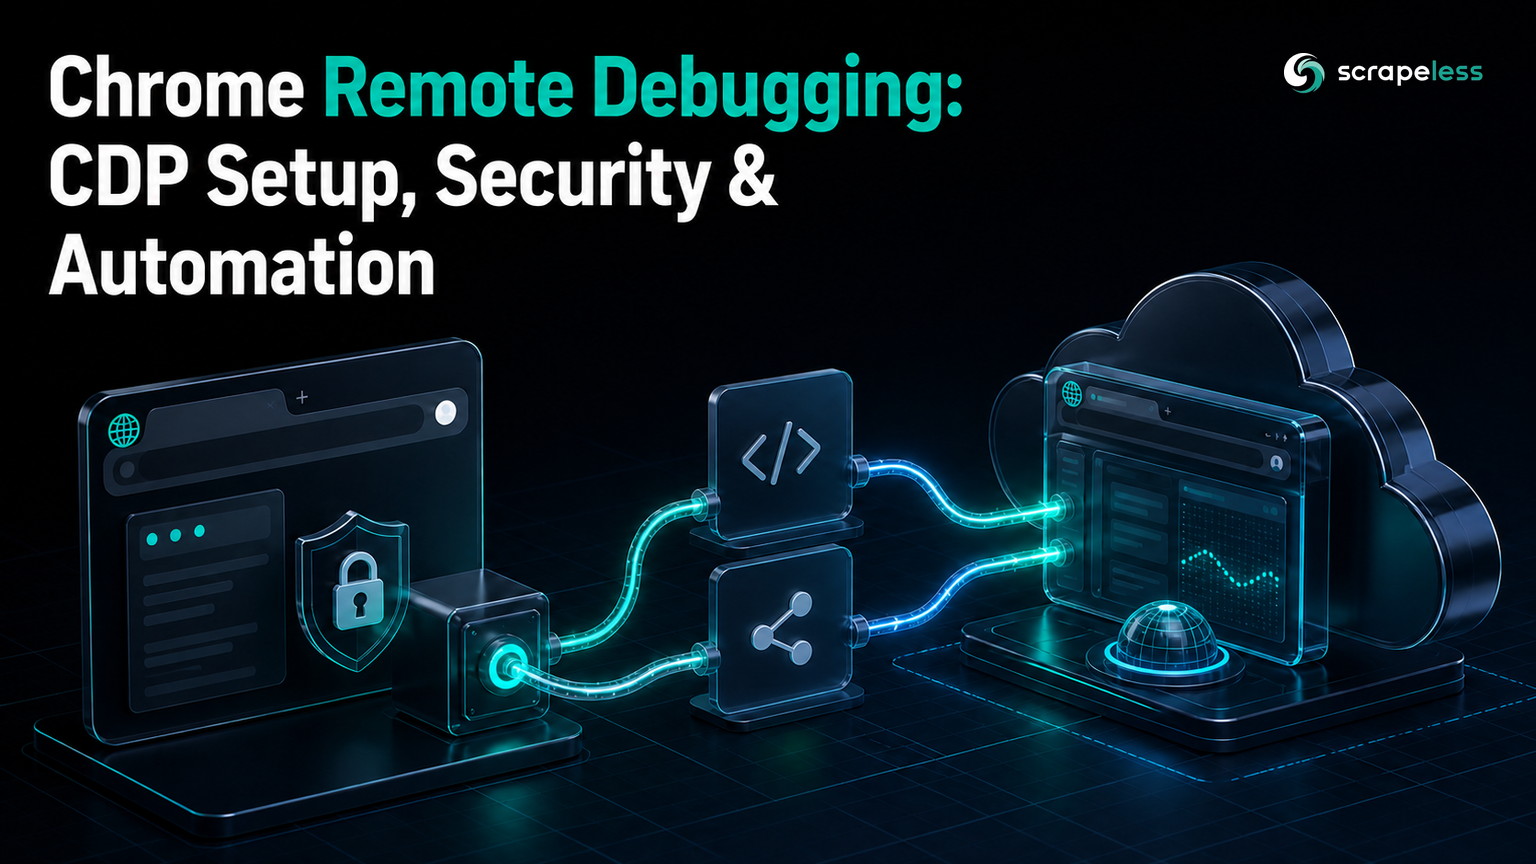
Chrome Remote Debugging: CDP Setup, Security & Automation

Senior Web Scraping Engineer
TL;DR:
- Chrome remote debugging exposes a running Chromium browser through the Chrome DevTools Protocol. Clients can inspect targets, send commands, receive events, and attach automation libraries without launching the browser themselves.
/json/versionidentifies the browser-level WebSocket endpoint./jsonand/json/listenumerate page targets, each with its ownwebSocketDebuggerUrl.- Port 9222 is a control interface, not a public application port. Bind it to loopback, use an isolated user-data directory, and never attach it to a real everyday profile.
- Current Chrome requires a non-default profile for remote-debugging switches. Chrome 136 and newer ignore these switches against the default Chrome data directory as a security measure.
- Puppeteer and Playwright can attach to an existing Chromium session over CDP. Puppeteer accepts a browser URL or WebSocket endpoint; Playwright provides
chromium.connectOverCDP()with a lower-fidelity connection than its native protocol. - Cloud CDP removes local browser operations from the client machine. Scrapeless Scraping Browser creates an isolated remote session and returns a WebSocket endpoint for Puppeteer or Playwright.
- Free to start. New Scrapeless accounts include free Scraping Browser runtime — sign up at app.scrapeless.com.
Introduction: a debugger socket can control the whole browser
Chrome remote debugging turns a running Chromium instance into a programmable target. DevTools, Puppeteer, Playwright, IDE integrations, and custom CDP clients can attach to the same protocol surface to inspect pages, evaluate JavaScript, watch network events, and drive browser actions.
That power creates a security boundary. A client with the browser WebSocket endpoint can reach browser-level domains and discover page targets. The endpoint should be treated like a short-lived privileged credential, even when it is listening only on a developer machine.
This guide starts a local isolated Chrome instance, inspects its JSON discovery endpoints, attaches Puppeteer and Playwright, covers Android forwarding, and then compares local port management with an isolated Scrapeless Scraping Browser session.
What Is Chrome Remote Debugging?
Chrome remote debugging is a transport that exposes Chromium instrumentation through the Chrome DevTools Protocol, or CDP. CDP is organized into domains such as Browser, Page, Runtime, Network, DOM, and Target; a client sends JSON commands and receives JSON events over WebSocket.
The official Chrome DevTools Protocol reference defines the protocol domains and the HTTP discovery endpoints available when Chrome starts with a remote-debugging port.
The protocol has two useful endpoint levels:
- Browser endpoint. The URL ends in
/devtools/browser/<id>and can discover or manage targets across the browser process. - Page endpoint. The URL ends in
/devtools/page/<id>and controls one tab or other page-like target.
The opaque IDs change with the browser process and target lifecycle. Discover them at runtime instead of constructing them.
Security Comes Before Setup
Chrome remote debugging should be bound to loopback and paired with a disposable profile. Exposing the port to a LAN, container ingress, tunnel, or public interface gives another client a path into a privileged browser control surface.
Chrome changed the behavior of remote-debugging switches in version 136. The Chrome remote-debugging security update states that --remote-debugging-port and --remote-debugging-pipe are ignored when they target the default Chrome data directory; a non-standard --user-data-dir is now required.
Apply these controls:
- bind the listener to
127.0.0.1; - create a temporary
--user-data-dirfor the debug session; - never use a profile that contains personal cookies, saved passwords, payment data, or active accounts;
- do not place the browser WebSocket URL in logs, tickets, screenshots, or shared configuration;
- run the browser under a low-privilege OS account;
- put remote automation behind authenticated infrastructure instead of publishing port 9222;
- close the browser and remove the temporary profile after the task.
Chrome for Testing is the better local automation binary when a build pipeline needs a reproducible browser rather than a developer’s installed Chrome channel.
Prerequisites
The local examples require Chrome or Chrome for Testing, Node.js, and two CDP clients.
- A current Chrome or Chrome for Testing build.
- A maintained Node.js release.
curlandjqfor inspecting the discovery endpoints.puppeteer-coreandplaywright-corefor the attach examples.@scrapeless-ai/sdkfor the cloud-session example.- A temporary directory that contains no real user profile data.
- A Scrapeless API key only for the cloud-session section.
Install the packages in an isolated project:
bash
npm install puppeteer-core playwright-core @scrapeless-ai/sdkThe local verification project installed puppeteer-core 25.5.0, playwright-core 1.62.1, and @scrapeless-ai/sdk 1.11.0. Package versions move independently, so pin them in production after the attach test passes for the project’s Chrome channel.
Start Chrome With an Isolated Debug Profile
Start a separate Chrome process with a loopback listener and a new user-data directory. The macOS command below runs headless so the session is easy to test from a terminal.
bash
DEBUG_PROFILE="$(mktemp -d)"

"/Applications/Google Chrome.app/Contents/MacOS/Google Chrome" \
  --headless=new \
  --remote-debugging-address=127.0.0.1 \
  --remote-debugging-port=9222 \
  --user-data-dir="${DEBUG_PROFILE}" \
  about:blank
On Linux, replace the executable path with the installed google-chrome or Chrome for Testing binary. On Windows, invoke chrome.exe from PowerShell and pass the same four flags as separate arguments.
Keep this terminal open. Chrome owns the debug listener for the lifetime of the process.
Inspect /json/version and /json/list
Chrome exposes browser metadata and target discovery on the same loopback port. /json/version returns the browser-level WebSocket endpoint; /json and /json/list return available targets.
bash
curl --fail --silent http://127.0.0.1:9222/json/version \
  | jq '{Browser, "Protocol-Version", webSocketDebuggerUrl}'

curl --fail --silent http://127.0.0.1:9222/json/list \
  | jq 'map({id, type, title, url, webSocketDebuggerUrl})'
The browser response contains Browser, Protocol-Version, User-Agent, engine metadata, and webSocketDebuggerUrl. A target-list record contains fields such as id, type, title, url, and its page-level webSocketDebuggerUrl.
Do not publish either WebSocket URL. The path ID does not replace network access control or authentication.
Connect Puppeteer to the Existing Browser
Puppeteer can discover the WebSocket endpoint from the local browser URL and attach without launching another Chrome process. The Puppeteer browser-endpoint reference maps the webSocketDebuggerUrl in /json/version to Puppeteer.connect().
javascript
import puppeteer from "puppeteer-core";

const browser = await puppeteer.connect({
  browserURL: "http://127.0.0.1:9222",
});

const pages = await browser.pages();
console.log({
  browser: await browser.version(),
  pageCount: pages.length,
  firstPageUrl: pages[0]?.url() ?? null,
});

browser.disconnect();
Use browser.disconnect() when the client should detach while Chrome keeps running. browser.close() asks the remote browser process to shut down.
Connect Playwright Over CDP
Playwright attaches to an existing Chromium browser through chromium.connectOverCDP(). The method accepts either the HTTP discovery URL or a browser WebSocket endpoint.
javascript
import { chromium } from "playwright-core";

const browser = await chromium.connectOverCDP("http://127.0.0.1:9222");
const contexts = browser.contexts();
const pages = contexts.flatMap((context) => context.pages());

console.log({
  contextCount: contexts.length,
  pageCount: pages.length,
  firstPageUrl: pages[0]?.url() ?? null,
});

await browser.close();
Playwright documents CDP attachment as lower fidelity than its native Playwright protocol. Chromium-only CDP attachment is appropriate when the browser already exists or a remote provider exposes CDP; advanced Playwright features should be tested against the exact remote browser contract.
Get your API key on the free plan: app.scrapeless.com
Remote Debugging on Android
Chrome on Android exposes its debugging socket through ADB forwarding rather than a public TCP listener. Enable developer options and USB debugging, connect the device, accept the device authorization prompt, and open Chrome on the device.
Note: This block requires an Android device with USB debugging enabled; the commands remain a hardware prerequisite in the verification ledger.
bash
adb devices -l
adb forward tcp:9222 localabstract:chrome_devtools_remote
curl --fail --silent http://127.0.0.1:9222/json/version | jq .
curl --fail --silent http://127.0.0.1:9222/json/list | jq .
The Chrome Android remote-debugging guide uses this socket-forwarding pattern. chrome://inspect/#devices provides the visual DevTools workflow, while the forwarded JSON endpoints support a direct CDP client.
Remove the forwarding rule and disable USB debugging when the device is no longer under test.
Treat the CDP Endpoint as a Privileged Credential
A CDP endpoint can expose page content, browser state, cookies available to the debug profile, network activity, and JavaScript execution. The safest design is to make the endpoint short-lived, private, and specific to one isolated task.
Avoid these patterns:
--remote-debugging-address=0.0.0.0on a workstation or server;- a firewall rule that exposes port 9222 to the internet;
- SSH or tunnel sharing without authentication and a strict destination policy;
- attaching to the default everyday Chrome profile;
- reusing one debug profile across users or tenants;
- storing browser WebSocket URLs in persistent logs;
- accepting a WebSocket URL supplied by an untrusted page or user without allowlisting its host.
For team automation, place session creation behind an authenticated control plane. The worker should receive only the endpoint for its own isolated session, and the control plane should enforce lifetime, region, ownership, and concurrency.
Move From a Local Port to Scrapeless Scraping Browser
Scrapeless Scraping Browser replaces the local Chrome process and exposed TCP port with an isolated cloud-browser session. The current SDK builds a session-specific browserWSEndpoint, and Puppeteer or Playwright attaches to that endpoint over CDP.
The SDK keeps session creation separate from the CDP client:
Note: The attach step requires a reader-owned
SCRAPELESS_API_KEY; SDK construction and endpoint generation were verified locally, while the live cloud connection remains a credential prerequisite.
javascript
import { Scrapeless } from "@scrapeless-ai/sdk";
import { chromium } from "playwright-core";

const client = new Scrapeless({
  apiKey: process.env.SCRAPELESS_API_KEY,
});

const { browserWSEndpoint } = client.browser.create({
  sessionName: "cdp-guide",
  sessionTTL: 180,
  proxyCountry: "US",
});

const browser = await chromium.connectOverCDP(browserWSEndpoint);
const context = browser.contexts()[0];
const page = context.pages()[0] ?? await context.newPage();

await page.goto("https://example.com", {
  waitUntil: "domcontentloaded",
});
console.log({ title: await page.title(), url: page.url() });

await browser.close();
The endpoint is a session credential. Keep it inside the process, close the browser when the task ends, and create a separate session for each independent worker or tenant.
For a page-discovery workflow that connects Playwright to a cloud CDP endpoint, see the rendered link-discovery method. The Scraping Browser documentation contains the current session and connection options.
Diagnose Connection Problems
Chrome remote-debugging failures become easier to isolate when the checks follow the connection layers.
| Symptom | Likely layer | Check |
|---|---|---|
| Port is closed | Browser launch | Confirm the process, executable path, flags, and isolated user-data directory |
/json/version is unavailable |
Listener or address | Confirm loopback address and port ownership |
| Browser endpoint exists but targets are empty | Target lifecycle | Open a page and inspect /json/list |
| Puppeteer cannot attach | Client or endpoint | Confirm browserURL or use the browser WebSocket URL from /json/version |
| Playwright attaches with missing features | Protocol fidelity | Test the required API against CDP and compare with Playwright’s native connection |
| Android list is empty | ADB authorization | Confirm USB debugging, device approval, Chrome state, and socket forwarding |
| Cloud endpoint is rejected | Session configuration | Confirm the API key, endpoint lifetime, and SDK-generated URL stays intact |
Check the discovery endpoint before debugging application code. If /json/version does not identify the expected browser, a library-level change cannot fix the listener or profile setup.
Conclusion: isolate the browser before you automate it
Chrome remote debugging is a high-privilege control channel built on CDP. Start Chrome with a loopback listener and disposable profile, discover the browser endpoint from /json/version, list page targets through /json/list, and attach only trusted clients.
Use local CDP for development and narrow test environments. Use an authenticated cloud-browser control plane when teams need isolated sessions, managed lifecycle, regional routing, or remote workers without opening a workstation port. The Scrapeless pricing page provides the current path for Scraping Browser runtime.
Ready to Move Your CDP Workflow to an Isolated Cloud Session?
Join our community to claim a free plan and connect with developers building secure browser-automation workflows: Discord · Telegram.
Sign up at app.scrapeless.com for free Scraping Browser runtime and connect Puppeteer or Playwright to a short-lived cloud CDP endpoint.
FAQ
Q: Is Chrome remote debugging safe?
Chrome remote debugging is safe only when the endpoint is private, short-lived, and attached to an isolated profile. Bind to loopback, use a non-default user-data directory, protect the WebSocket URL, and never expose port 9222 publicly.
Q: Is scraping through CDP legal?
CDP is a browser-control protocol; legality depends on the target data, access method, jurisdiction, terms, and use. Limit collection to public or authorized data, respect site rules and access controls, minimize personal data, and consult counsel for high-risk projects.
Q: Do I need a proxy for Chrome remote debugging?
Local CDP does not require a proxy, but a target may need a permitted regional network path. Scrapeless Scraping Browser can create the remote session with a documented proxy country so the CDP client does not operate a separate proxy layer.
Q: What should I do when the page shows a traffic-validation screen?
Keep the target and its homepage in one authorized session, pin the required country, load the homepage first, and then navigate to the public target page. Confirm the visible heading before extraction and stop if the page requires private access or an action outside the project’s policy.
Q: What happens when the DOM or selectors change?
Reinspect the rendered page and tighten selectors around stable attributes, accessible names, or durable URL patterns. Treat missing fields as nullable until the updated selector passes a content-level test.
Q: How much concurrency should a CDP scraper use?
Start with one isolated session per worker and increase parallel work only after measuring page load, memory, target limits, and acceptance rates on the actual host.
Q: Can I use CDP without a model-based agent, and can I reuse its WebSocket URL?
Puppeteer and Playwright can use CDP directly without a model-based agent. Browser and page WebSocket IDs are opaque and session-specific, so discover them at runtime and do not reuse an endpoint after its browser session ends.
At Scrapeless, we only access publicly available data while strictly complying with applicable laws, regulations, and website privacy policies. The content in this blog is for demonstration purposes only and does not involve any illegal or infringing activities. We make no guarantees and disclaim all liability for the use of information from this blog or third-party links. Before engaging in any scraping activities, consult your legal advisor and review the target website's terms of service or obtain the necessary permissions.